
Click Here for a Printer Friendly Version
Quick Note Regarding Year-End Distributions: Stock funds (e.g., mutual funds, exchange-traded funds, closed end funds, etc.) must distribute realized long-term capital gains, short-terms gains, and income to shareholders by the end of the calendar year. When this occurs, the fund’s share price will drop by the amount of the distribution, and it will seem like you have lost money. That’s not the case. Shortly after the share price is lowered, you will either receive more shares or additional cash back in your account. Please give us a buzz if you have any questions about year-end distributions.
Investing in risk assets like stocks, real estate, and crypto has rarely been so good. The large-stock barometer, the S&P 500, has been notching high after record high. Residential property prices have been sitting near record peaks. And cryptocurrencies have been rocketing to places few could have imagined just a few years ago.
Even bonds had been showing signs of resilience. Bond yields had been moving modestly lower, propping up bond prices. Meanwhile, quality bonds have been yielding a relatively attractive 4%-5%.
Perhaps unfortunately, when phenomenal gains occur with little resistance, many begin to dismiss the things that go wrong. They talk about bitcoin passing 100,000. They discuss AI stocks in terms of no-lose propositions. And they ignore mounting signs of turmoil ahead.
Until now.
Today, the Federal Reserve cut its overnight lending rate to a range of 4.25%-4.50%. That was expected. However, the Fed signaled that it only expects to cut rates two times in 2025. This fell dramatically short of the four, five, or six cuts that market participants had come to anticipate.
The Dow promptly fell 1000 points. Likewise, the benchmark S&P 500 gave up 3.0% in the singular trading session.
Prior to today’s setback, surveys had implied that households were more excited about the market’s prospects than ever before. Similarly, the Investor Intelligence’s weekly survey suggested that investment newsletter writers had rarely been so bullish on stocks.
Exuberance, however, may have gone too far. For example, Apple’s price relative to its “book value” has never been more extreme. It sports a price-to-book (P/B) close to 10.0, far above its longer-term average of 2.8.
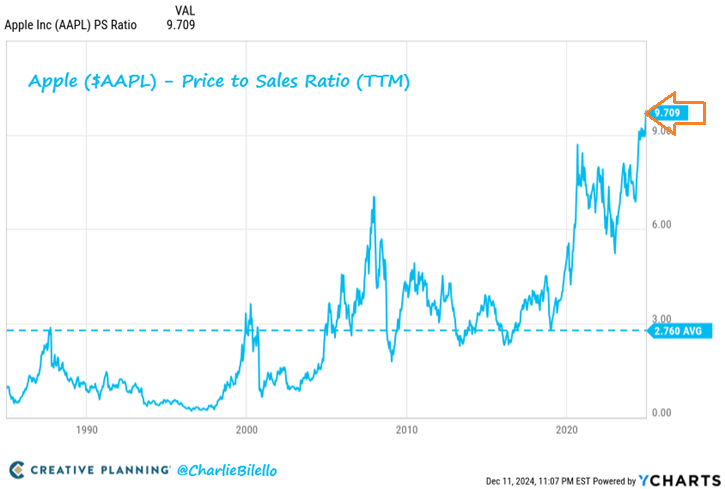
Is overvaluation merely an Apple thing? Hardly.
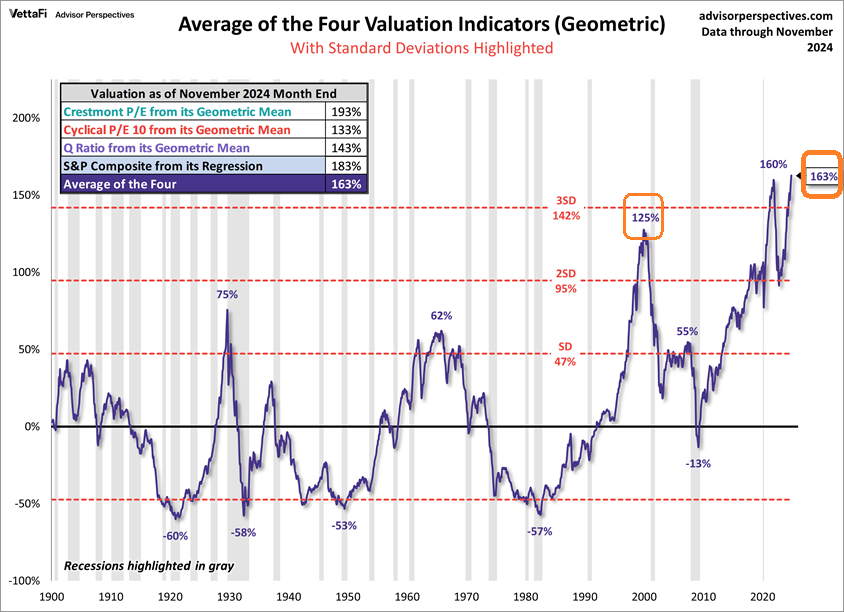
On a wide variety of fair value indicators (e.g., price-to-earnings, Q Ratio, regression, etc.), stocks are pricier than they were at the top of 2000’s dot-com bubble.
Of course, overpriced stocks can always get pricier. There are no limits to speculation… at least not until something goes awry.
So, why did the central bank of the United States (a.k.a. “the Fed”) formally dial back its plans for future rate cuts? A belief that the U.S. economy will continue to grow briskly, alongside a belief that there is little to worry about on the unemployment front.
In truth, economic indications have been a mixed bag of nuts. Consumer spending has been remarkably strong, yet manufacturers have been battling recessionary pressure.
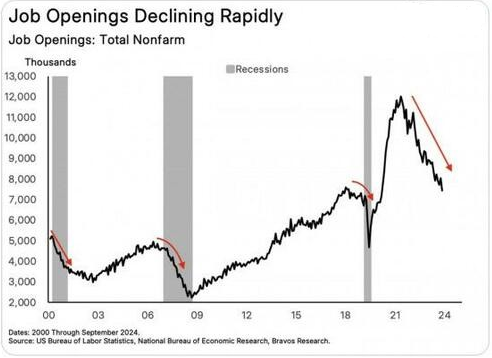
The unemployment picture is murky as well. The headline rate remains quite low. Yet, the percentage of small businesses planning to hire has dropped significantly, while the number of job openings has been declining at a pace consistent with an economic downturn.
There are additional wildcards. For instance, few economists can forecast the influence of tariffs on trade.
If past is prologue, the so-called “trade war” in 2018 did not cause inflation to move higher; rather, inflation only became a major problem after the Federal Reserve and the U.S. government provided trillions upon trillions in dollar giveaway stimulus to manage the pandemic shutdowns.
It is worth noting, though, that the U.S. Trade Policy Uncertainty Index recently spiked. The last time that it did, stock volatility surged.
Still, nothing is as powerful in moving the markets as the “price of money.” On that score, it may continue to be relatively expensive to borrow in 2025, both for households and small businesses.
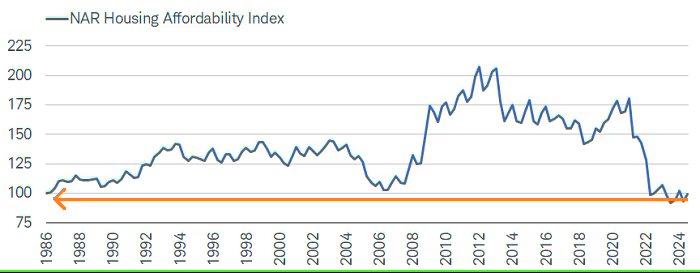
With fewer rate cuts in 2025, and with the 30-year mortgage stuck between 6.5%-7.0%, real estate transactions are likely to remain near 1990 levels. Meanwhile, affordability is as bad as it was in the mid-1980s.
In sum, stocks may be in for a wild ride in 2025.
The good news is that Pacific Park Financial has a tried-n-true approach for dealing with stock price volatility. Specifically, when the monthly closing price of the stock market is above its long-term trendline, we maintain target stock risk levels. (See the green dots and blue trendline in the chart below.)
In contrast, when the monthly closing price falls below its long-term trend, we receive a red data point. The red dots warn us about the possibility of sharp price declines.
We also utilize data from the trendline’s direction, or slope. When the slope of the blue trendline is rising, risk taking in stocks is still favorable. When the trendline is falling? This is a sign to decrease stock risk in client portfolios.
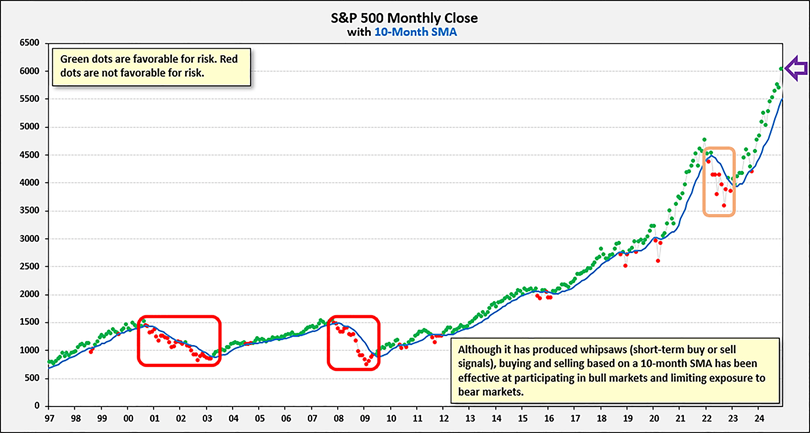
These signals served admirably to limit loss in 2022’s stock-bond bear. Moreover, trend observers were able to sidestep a large chunk of 2000’s stock market wreck as well as 2008’s financial crisis.
Do you have a question about Pacific Park’s process? Please reach out to us for a conversation or meeting.
Warmest Regards,
Gary Gordon, MS, CFP
President